


How To Become a Valuation Ninja
Evaluate and value businesses with confidence.

Value investing has proven to deliver the best performance over time. There are legendary value investors like Warren Buffett, Peter Lynch, Ray Dalio, and Chris John, who have built great wealth over decades by finding undervalued stocks and holding them for a long time.
In this article, I will show you, step by step, how you can become a stock valuation ninja—how you can identify and value stocks to determine if a given stock is worth buying.
First of all, besides the value itself, I also prefer growth characteristics, as finding great value companies with steady growth produces the best results.
And here is the proof of that:

Source: msci.com
For screening I use stockanalysis.com, it has global coverage, good historical data and is very reasonably priced.
In order to decide whether or not to invest in a company, I go through a three-step process:
finding potential opportunities
analysing the company’s operation
performing valuation
1. Finding Potential Opportunites
I set the following filters:
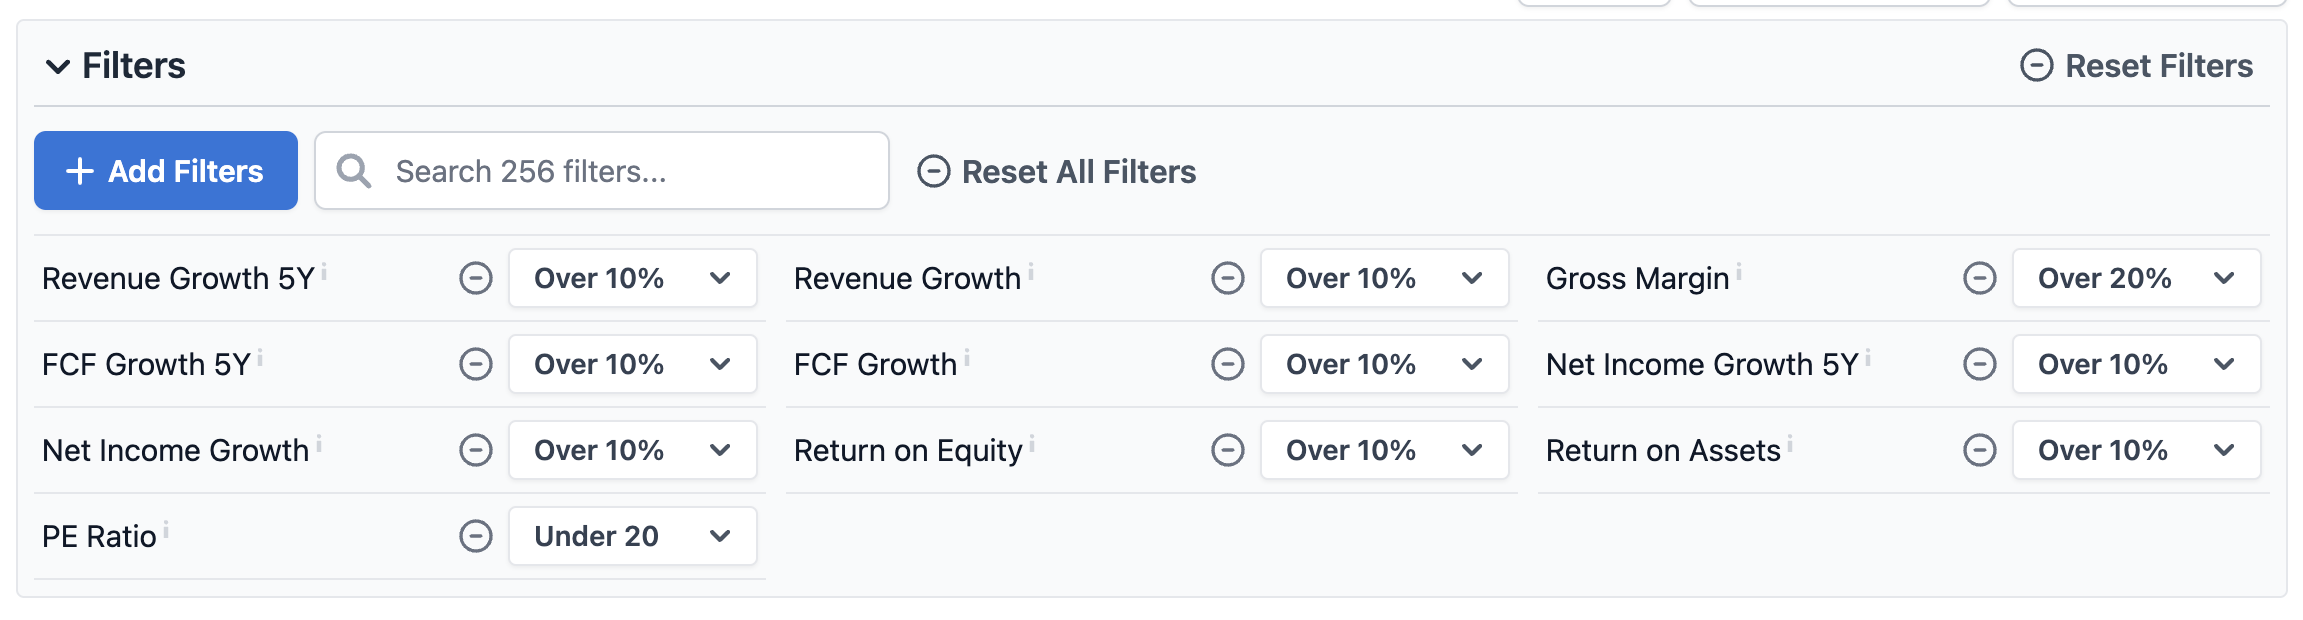
This provides a good enough list of stocks to start the analysis.
2. Analysing The Business Performance
For this article, let’s take a deep dive into Alphabet Inc. (GOOGL) based on its FY 2024 reports.
If the company has a long history, I like to analyze a 20-year period.
For all metrics, I check the 20-year, 15-year, 10-year, 5-year averages, and TTM figures.
This provides a comprehensive view of the stability of the company’s performance.
a. Quality of Business
Quality of business, to me, means how efficiently the company is operating. To assess business quality, I look at the following figures:
Gross margin: I prefer companies with at least a 40% gross margin. Alphabet has managed to keep it above 50%, which is exceptionally good and demonstrates pricing efficiency. Internet software companies are usually around 50%, but given the size of Alphabet, maintaining above 50% can be considered very strong.
Net income margin: This shows how much net profit a company generates per dollar of revenue. Ideally, it should be above 20%. Again, Alphabet has performed very well, keeping it above 20%, which is excellent for the industry.
Return on Equity (RoE): This indicates how much profit the company makes for every dollar invested by shareholders. Above 20% is very good. Alphabet has performed quite well, reaching around 20% or above, which is at or above the industry average. Given the company’s size, this is an excellent result.
Free cash flow (FCF) margin: The cash generation capability of a company is very important, as growth can be financed or dividends can be paid from cash. FCF is calculated as operating cash flow minus capital expenditures. It is the cash that is free to be distributed to security holders, including debt holders. An FCF margin above 15% can be considered good. Alphabet’s cash generation often exceeds 20%.
Owner earnings margin: Owner earnings is a concept created by Warren Buffett. It is similar to FCF, with key differences: a) it averages out annual CAPEX spending required to maintain the company’s competitive position, and b) it reflects the cash remaining after everything (interest, tax, debt service) is paid by the company.
EVA margin: Economic Value Added (EVA) captures the true economic profit (value) generated by the company. An EVA margin above 10% is good. Alphabet consistently delivers an EVA margin above 10%. In general, this measure may be lower for companies with high intangible assets and goodwill (like tech companies), but this is not the case for Alphabet.
Here is my scorecard for these quality measures:

b) Growth aspects
Finding a good quality business does not automatically mean that we want to invest in it. According to the measures above, a business can be high quality even without making significant progress (i.e., without growth).
Therefore, I also look at the growth aspect of the company. If a company is producing consistent growth of 10% or more (CAGR), I consider it good.
Revenue growth (CAGR %): Alphabet’s revenue has been growing steadily in the last 20 years.

FCF growth (CAGR%): Alphabet’s FCF growth has also consistently been above 10%. Growth has slowed down in the last 5 years, but given the company’s size, this is acceptable and still above 10%.

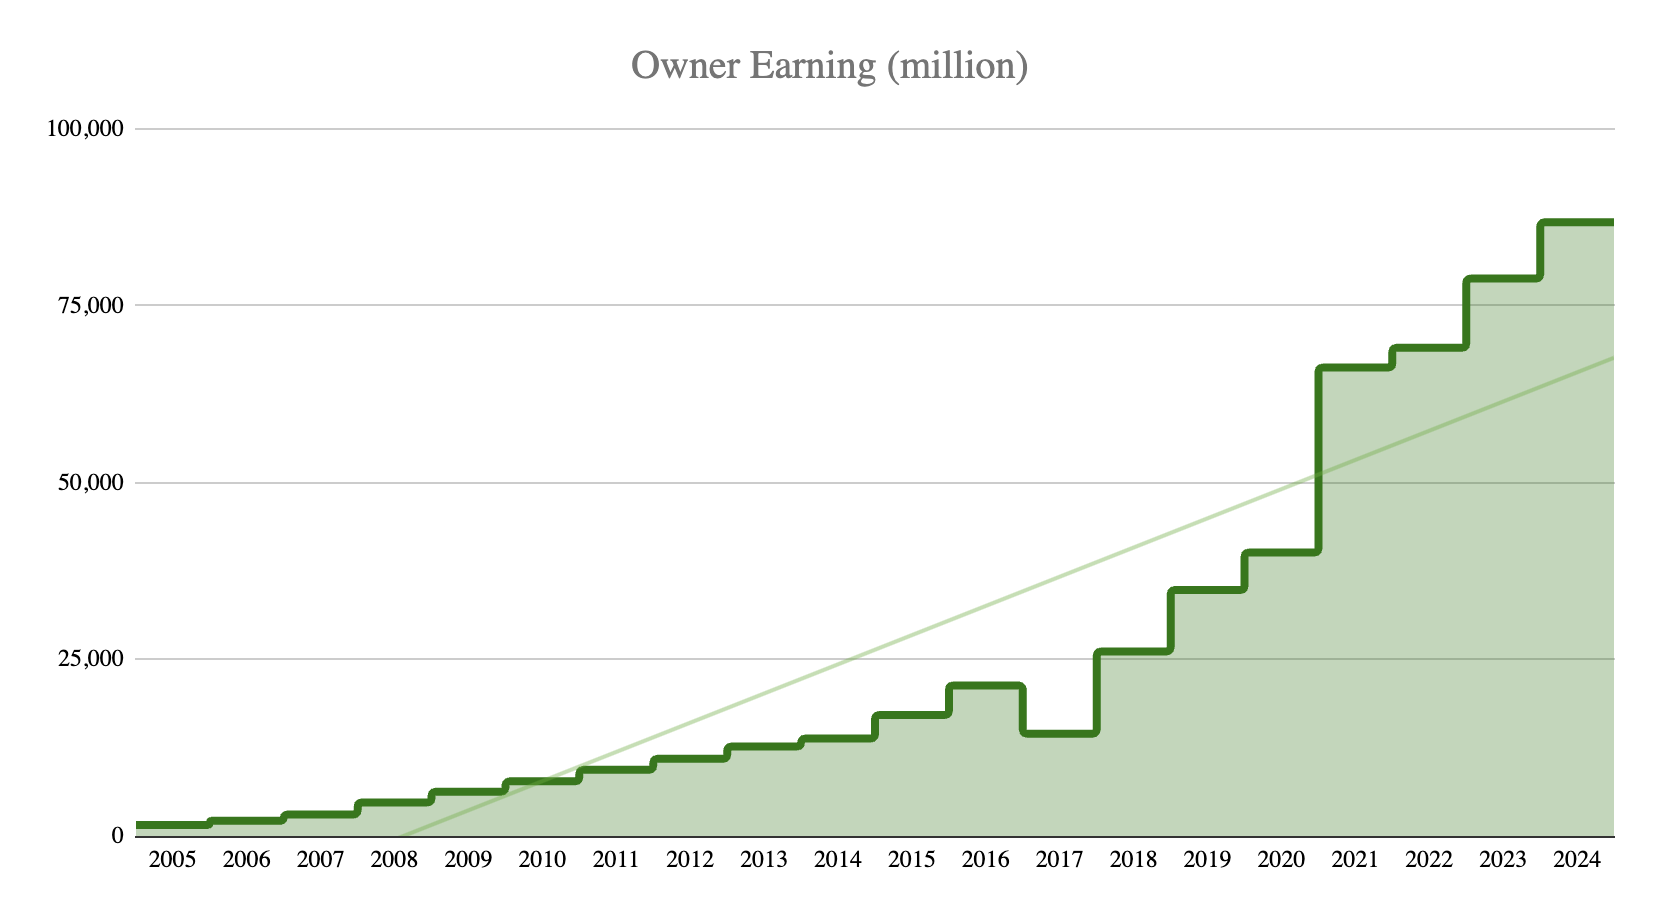
Owner earning growth (CAGR %): The growth rate is consistent and high, above 15% for all periods.
EVA margin growth (CAGR %): Alphabet is performing excellently again, with a growth rate above 20% for all periods. Growth has even accelerated in the last 5 years, with a CAGR of 35%.

Here is my scorecard for the growth measures:

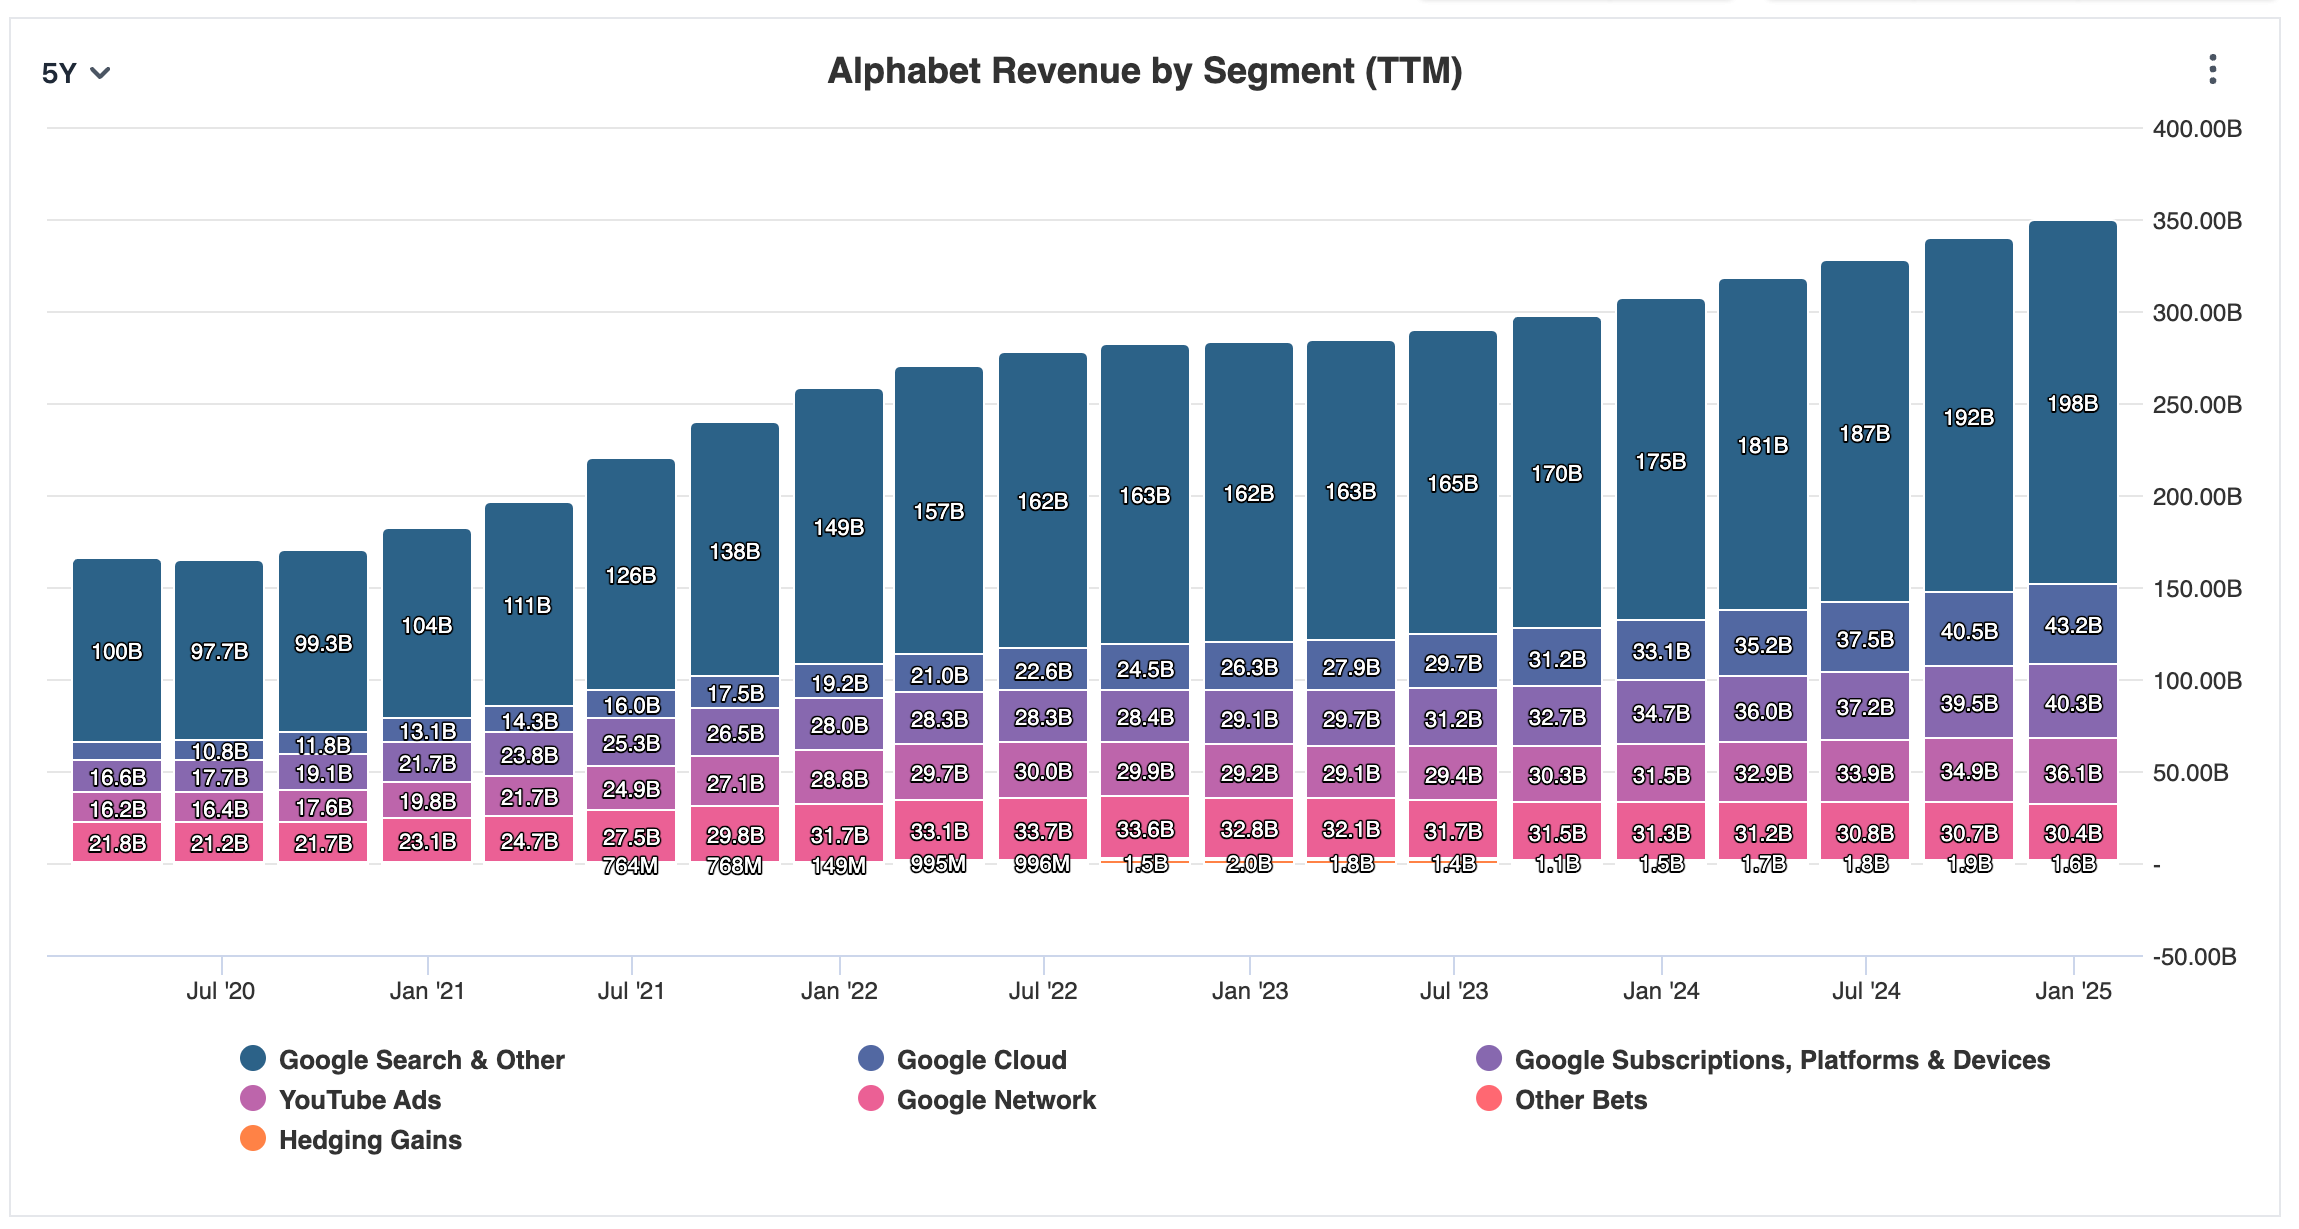
Looking at Alphabet’s portfolio, the company has managed to produce impressive growth in all segments over the last 5 years.
Regarding future growth prospects, the outlook is positive. Even in the pessimistic scenario, revenue growth is projected over the next three years.

c) Financial Health
After confirming that Alphabet is a top-quality company with an excellent growth history and strong prospects, let’s look at the metrics reflecting its financial health.
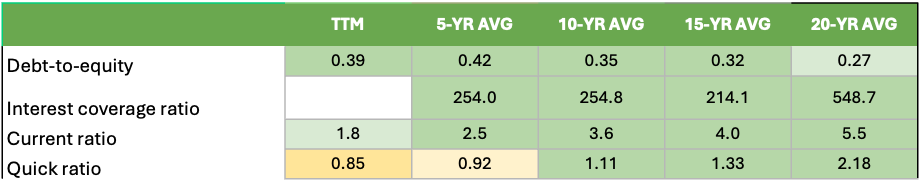
Debt-to-equity ratio: over the last 20 years, Alphabet has kept its debt-to-equity ratio in the 0.25–0.40 range, which is a very healthy mix of using debt versus its own resources to finance operations. In comparison, Apple’s D/E ratio is around 1.4, and the industry average is around 0.85–0.90.
Interest coverage ratio: this shows how easily a company can pay its interest obligations. Usually, a ratio of 2 or above is considered good. Alphabet’s interest coverage ratio is above 200 for all periods, indicating excellent financial strength.
Liquidity assessment:
Current ratio: this liquidity ratio shows how easily the company can pay its short-term obligations—in other words, how many times its assets cover its liabilities. Usually, a current ratio above 2 is considered good. Alphabet has maintained a ratio well above 2 for all periods except FY2024, when it was 1.8. Given the strong FCF margin and the company’s size, this is not an area of concern.
Quick ratio: this acid-test ratio shows the company’s ability to use its quick assets (i.e., cash or “near-cash” assets) to pay all its short-term obligations. Ideally, this ratio is 1 or above. In the last 5 years and in FY2024, it was around 0.9 for Alphabet, which is acceptable considering the company’s Cash Conversion Cycle (the time needed to convert inventory to cash) was 31.09 days in Q4 2024.
Here is my scorecard for the financial health measures:
d) Quality Of The Management
By now, we know that Alphabet is a top-quality business with excellent growth and strong financial health. As the next step in the analysis, let’s look at the quality of management. For this, I use the following measures:
Return on Assets (RoA, %): this shows how much profit the company generates from its assets. Anything above 15% is good. Alphabet is around 15% for all periods and is showing an improving trend. Furthermore, the industry average is around 0% as of April 2025.
Quality of capital allocation:
Return On Invested Capital (ROIC %): this shows how efficiently the company is using its capital to generate profit. An ROIC at or above 10% is considered good. For Alphabet, it was above this threshold for all periods and has even improved over time, reaching an impressive 25.33% in FY2024. This is even more impressive considering that the software industry’s ROIC is slightly negative.
Cash Return On Invested Capital (CROIC %): this shows the company’s cash generation efficiency for its invested capital. Anything above 10% is good. Alphabet’s CROIC has been in the range of 15–21% for all periods, which is also impressive.
Even though the above capital allocation metrics are impressive, the most important point is that both ROIC and CROIC are higher than the cost of capital. In Alphabet’s case, WACC was around 4–5% for all periods, so the above ROIC and CROIC figures are truly outstanding.
As I mentioned above, the company’s cash generation capability is key to business success. Management has several options for using this excess cash. I usually look at the following metrics, as they indicate straightforward value for shareholders.
Dividend yield: Alphabet pays some dividend, but the dividend yield is quite low (0.31%), which is acceptable considering the growth the company has produced over the last 20 years.
Share buybacks / issuance: the number of outstanding shares has been declining at a pace of around 2% over the last 5 years, which has a positive effect on the stock price.
If there is low or no dividend yield and/or share buybacks, it is not necessarily a problem. If management reinvests cash into further growth (e.g., acquisitions), that will also create shareholder value over time, provided other metrics are satisfactory.
e) Company’s Moat
Above metrics suggest that Alphabet has a wide moat, let’s look at what the components of it could be:
Brand: Google brand is very strong. The brand name even became an official verb describing the act of using an online search engine (added to Oxford English Dictionary)
Network effect: it is definitely the case for Alphabet (Google), the more people are using the company’s product the more accurate the search results or the ad targeting capabilities would be. There are 3 billion active Android devices out on the market, it dominates the market with 71% market share. Also, Google is the king of search still in 2025 with 16.4 billion searches every day, which is a 90% global market share. Also 96% of brands around the world use Google Ads.
Economies of scale: Alphabet’s size allows for maximised purchasing power
Risks
AI: With the emergence of generative AI, there is a shift in the online searches towards AI base searches. It is a risk that strong players in the AI space like OpenAI could carve out a significant portion from this market, weakening Google’s position.
Regulatory risks: In case of Google, the company's dominance in search and in its Android mobile operating system is so strong that regulators are trying to crack down the monopoly, e.g. through an anti-trust case. But given the legacy status of Google likely these attempts will cause only a marginal harm to the company.
3. Valuation
Now we know that Alphabet is a business we could consider investing in. The big question is: what price should we pay? Of course, the goal is to buy stocks at or below their so-called intrinsic value (the true value of the stock). This part of the process is more of an “art” than a science.
“It's better to be approximately right, than precisely wrong!” - initially crafted by Carveth Read popularized by Warren Buffet in the 90s
First of all, true value contains highly subjective elements. The higher your expectation for return, the lower the intrinsic value should be at which you purchase a stock.
This is how I approach the valuation process:
a) set expected return: I usually set this to 15%. This will be used as the discount rate.
b) set the starting growth rate: I typically use the median annual growth rate in Owner Earnings over the past 20 years by default. This is not set in stone. If the company’s growth has slowed down in the last 5 years, or vice versa, I may adjust the assumed growth rate. Also, it is wise to “play with” different growth scenarios to see how they affect the intrinsic value. The growth rate will be used to forecast the future owner earnings the company will generate over the next 20 years. Since it is unrealistic to assume the starting growth rate can be maintained for the entire 20 years, I usually adjust the growth rates used in the calculation as follows:
Next 1-5 years: starting growth rate
6-10 years: 75% of starting growth rate
11-15 years: 50% of starting growth rate
16-20 years: 25% of starting growth rate
c) set safety margin: The safety margin is a tool to mitigate the risk of being wrong. For large companies like Google, a 10% safety margin is sufficient. For large-cap companies, I usually use 25%; for mid-cap companies, 50%; and for small-cap companies, 75%.
Based on the above parameters, I calculate the sum of owner earnings for the next 20 years, discount it at my expected return rate, and finally adjust it with the safety margin.
In the case of Alphabet, this is how my calculation looks:
Expected return: 15%
Starting growth rate: 17.48% (the median annual growth rate in the past 20 years)
The owner earning for 2024 was $86.4 bn.
Using the growth rates, the sum of owner earnings the company would generate in the next 20 years: $6.1 tn and its NPV value is $1.51 tnCalculating the intrinsic value:
Total equity ($325 bn) + NPV of generated owner earning ($6.1 tn) with 15% discount rate, divided by no. of shares outstanding (12.4 bn) adjusted by the margin of safety (10%).
( $325 bn + $1.551 bn ) / 12.4 bn * (1 - 0.1) = $136
At the time of writing this article, GOOGL share price was $153, i.e., it is overvalued according to our calculations.
If someone is happy with a 10% annual return, the intrinsic value would be $198, so it could be a buy at the current price. That is why there is no universal intrinsic value — it also depends on subjective parameters.
I understand that this may seem a bit complicated, but Asymmetric Edge is here to help you find good investment opportunities based on this method.
I wish all of you happy and successful investing!